


An Introduction to PlugShare
PlugShare is a popular app among EV owners, known for its large and active user community. It enables users to search for charging stations by location, filter by network, and get directions to the nearest charger. PlugShare also offers valuable user-generated content, including reviews, PlugScores, and photos, to help users make informed decisions about where to charge.
A standout feature of PlugShare is the PlugScore—a rating that indicates the likelihood of successfully charging at a particular location (10 being very likely, 0 not likely). The app also emphasizes a social aspect, allowing users to share real-time updates on charging stations, such as status changes or helpful tips. Additionally, users can earn rewards by contributing to the PlugShare community, like adding new charging stations or updating information on existing ones.
[insert image of a user using plugshare here]
I myself use PlugShare to locate charging stations when I am traveling or on the go. It has been a valuable tool for me, allowing me to find the best charging spots quickly and easily. Sometimes I do use it as well to help the community by reporting EV charging stations that have issues or are out of service.
PlugScore: Ensuring Charging Reliability
The PlugScore is a unique and valuable feature of the PlugShare app that provides electric vehicle users with a quick and easy way to evaluate charging stations. It serves as a rating system that indicates the likelihood of successfully charging at a specific location, with scores ranging from 0 to 10—10 being highly likely and 0 being less so. The PlugScore is generated based on multiple factors, including user reviews, reported reliability, and recent check-ins. By incorporating real-time data from PlugShare’s active community, the PlugScore offers an informed and accurate assessment of each charging station’s dependability.
This feature is especially useful for EV owners who need reliable charging solutions, whether on long road trips or simply running errands around town. Instead of taking chances with unreliable stations, users can rely on PlugScores to guide them toward chargers with a solid track record. The PlugScore helps users save time and avoid frustration by providing a clear indicator of station performance, allowing them to choose locations where they are more likely to have a seamless charging experience. Ultimately, PlugScore adds an important layer of transparency and trust to the charging process, making it easier for EV drivers to plan their routes and stay charged wherever they go.
heuristic evaluation and Pain Points
To pinpoint the biggest usability issues, I used a mix of Heuristic Evaluation, Guerrilla User Testing, and User Interviews—basically, a blend of expert review and real-world feedback. With Heuristic Evaluation, I took a step back and looked at the app through a usability lens, checking for things like visibility of system status, recognition over recall, efficiency, and ease of navigation. Right away, I noticed some key problems: there was no quick way to see available chargers, charger types weren’t clearly differentiated, and the icons didn’t communicate enough on their own. On top of that, some simple tasks required way too many taps, making the experience more frustrating than it needed to be.
To see how this played out in real life, I ran Guerrilla User Testing, watching EV drivers try to use the app in everyday scenarios. It was clear that people expected to spot available chargers at a glance—but instead, they had to tap through multiple screens. Many also had trouble figuring out if a station had fast charging, since the icons and labels weren’t obvious. To dig deeper, I conducted User Interviews with regular EV drivers, and their feedback reinforced what I saw in testing. They wanted clearer charger info, streamlined navigation, and information that actually made sense at a glance. Putting all this together, I had a solid understanding of where the app was falling short and a clear direction for how to fix it.
- Lack of a Quick, Glanceable View of Available Chargers Users struggle to quickly see open charging spots How this affects user efficiency and decision-making
- Unclear Information on Charger Types Difficulty in identifying fast chargers vs. Level 3+ chargers Misleading or incomplete information causing frustration
- Confusing Iconography Over-reliance on unclear symbols Lack of visual hierarchy leading to misinterpretation
- Too Many Steps to Complete a Task Users need multiple taps to complete simple actions How this creates friction in navigation
The design process
I followed the Stanford d.school’s Design Thinking process to guide both the discovery and solution phases of this project. Early on, it helped me focus on real user frustrations rather than surface-level assumptions. By combining user research, testing, and expert evaluation, I was able to uncover the biggest usability roadblocks—like the lack of glanceable charger availability, unclear charger types, confusing icons, and too many taps to complete tasks. I’m using that same process to solve these issues, iterating on designs based on real user behavior and feedback. Instead of just making the app look more modern, I’m ensuring it actually works better for EV drivers, streamlining navigation, improving clarity, and reducing friction at every step.

Final Design & Key Improvements
- At-a-Glance Charger Availability Redesigned the UI to highlight real-time charger availability Implemented a color-coded system for quick visual scanning
- Clearer Charger Type Differentiation Introduced distinct labels for charger levels and speeds Ensured users could filter by charger type easily
- Improved Iconography & Visual Hierarchy Designed more intuitive icons with supporting text Created a consistent visual system for better recognition
- Streamlined Navigation & Task Flow Reduced taps needed to perform key actions Introduced shortcuts and smart suggestions for efficiency
Road to final product
Conducting user tests can be a crucial step in the development process of an idea or a product. By engaging with potential users and gathering their feedback, I was able to gain valuable insights into our needs, preferences, and pain points. This feedback allowed me to iterate and improve upon the initial concept. The feedback I received was mostly positive, and it helped me refine and establish my idea that it is not too far off the current UI.
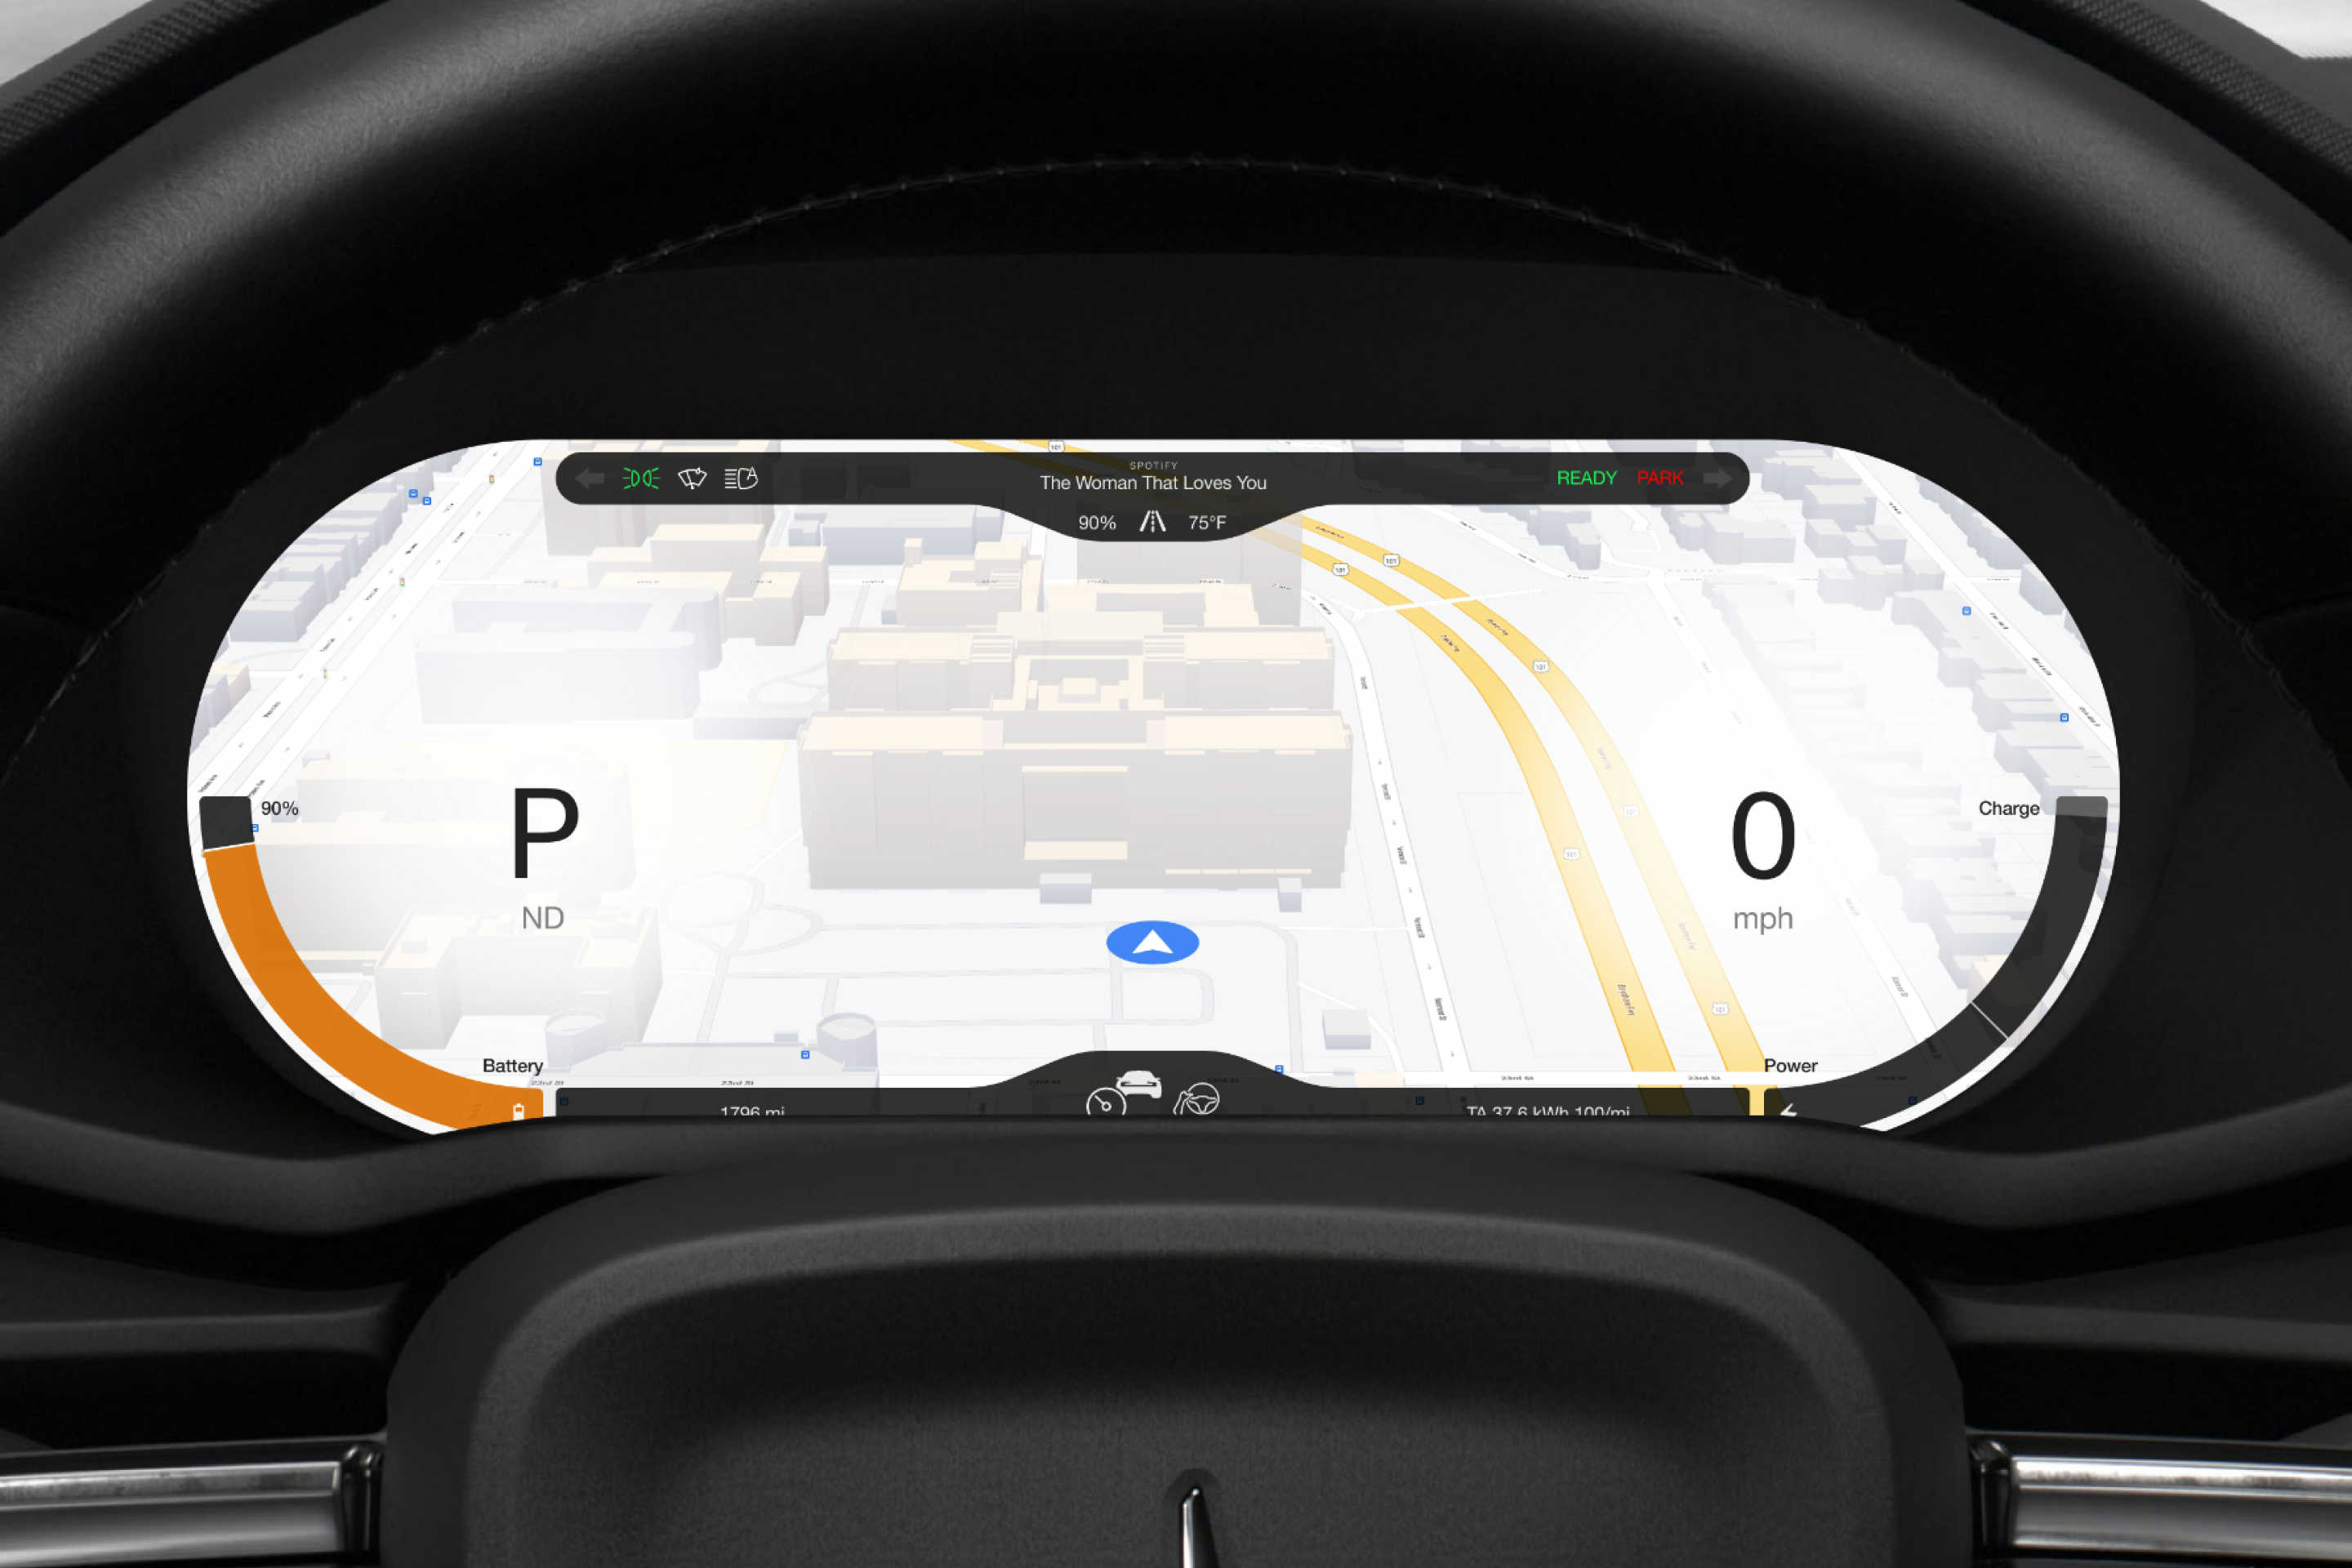
Visual elements such as colors, typography, and overall aesthetics can convey a brand’s identity and values. By incorporating these elements into the design more effectively, I created a much more cohesive and consistent brand experience. It’s important to consider how our design choices resonate with the existing brand identity. By analyzing Polestar’s brand guidelines meticulously, I was able to identify the design language, key features, and visual cues that defined the brand. Incorporating these elements into the final design helped establish a strong brand connection and fosters brand recognition and loyalty, which led me to this final design:


Creating a working prototype was an important milestone because it allowed me to validate and convey my idea further and test its feasibility. It provided a tangible representation of the concept, enabled me to gather more focused feedback from users and stakeholders. This iterative process of gathering feedback, refining the concept, and building a prototype helped me move closer to a finalized product that meets user needs and expectations. Here’s a demonstration on how it transitions when a user changes the display mode.
When developing a product, it’s crucial to ensure that the design aligns with the brand’s values, target audience, and market positioning. This consistency creates a unified brand experience and strengthens the overall brand perception. By leveraging the visual cues from the current UI of the Polestar 2’s instrument panel, I made sure that the design not only matches the brand but also resonates with the intended users and effectively communicates the brand’s identity. Here are some images as well along with some of Polestar 2’s product images showcase how the new design matches Polestar’s brand.
Conclusion & Impact
How the redesign improved user experience Metrics showing increased engagement and efficiency Final thoughts on the power of user-centered design


What’s next?
Well, as much as I love the car and the brand, they tend to go too minimalists not only with their BEV, but as well with their native iOS and Android apps so I will probably redesign those as well. Stay tuned. 😎